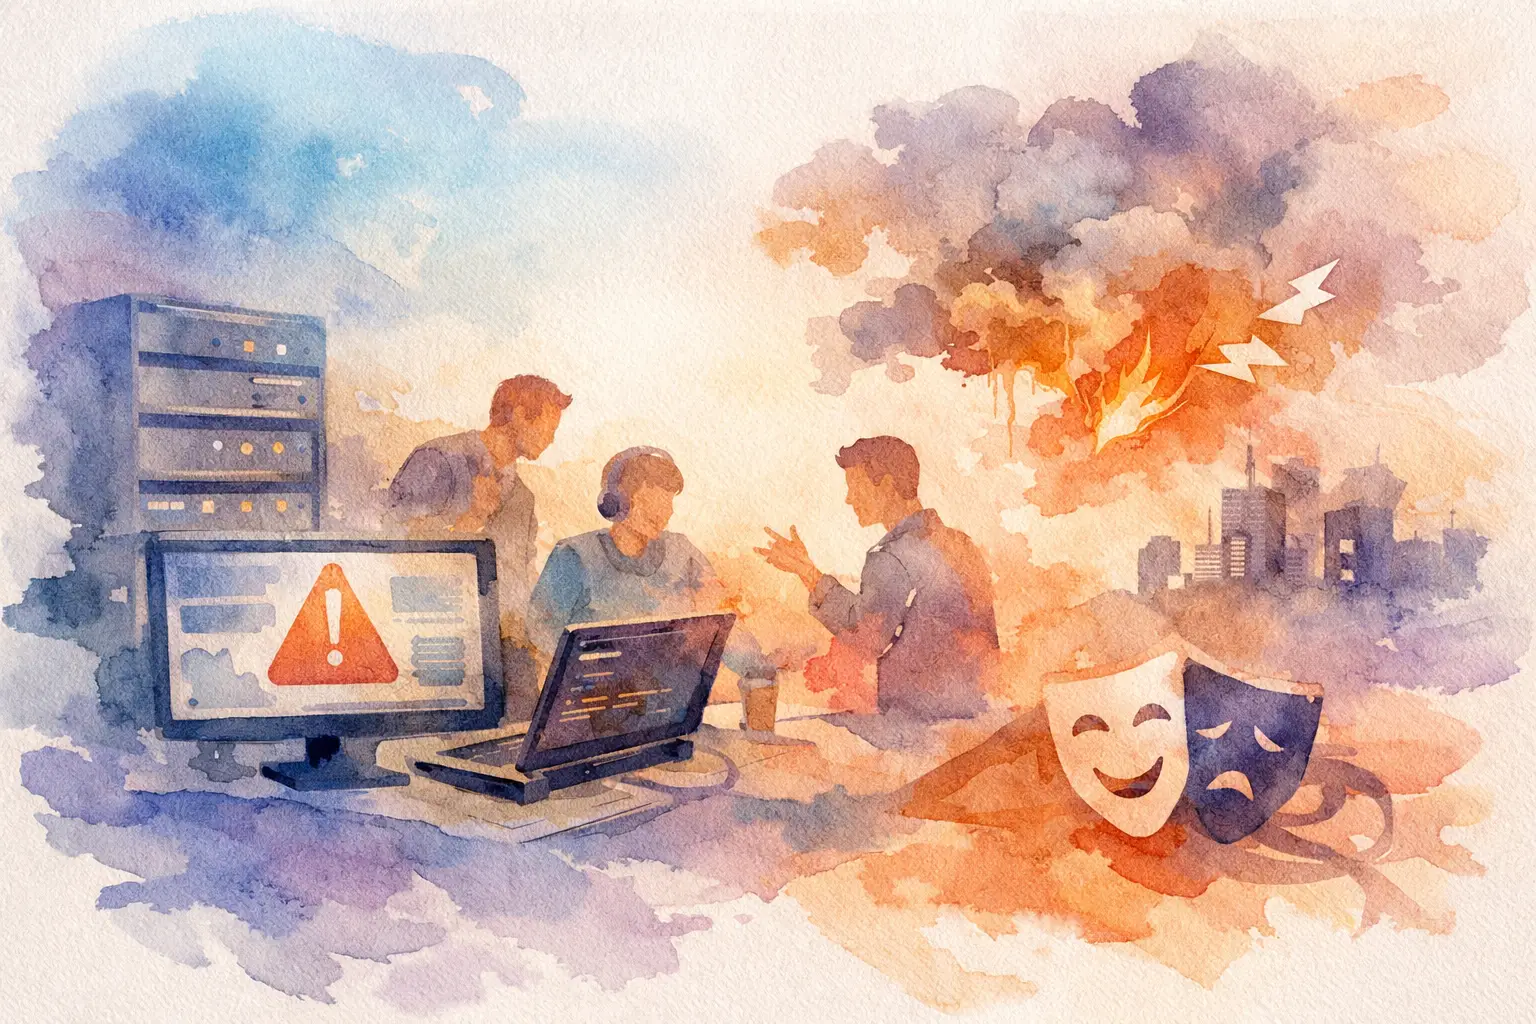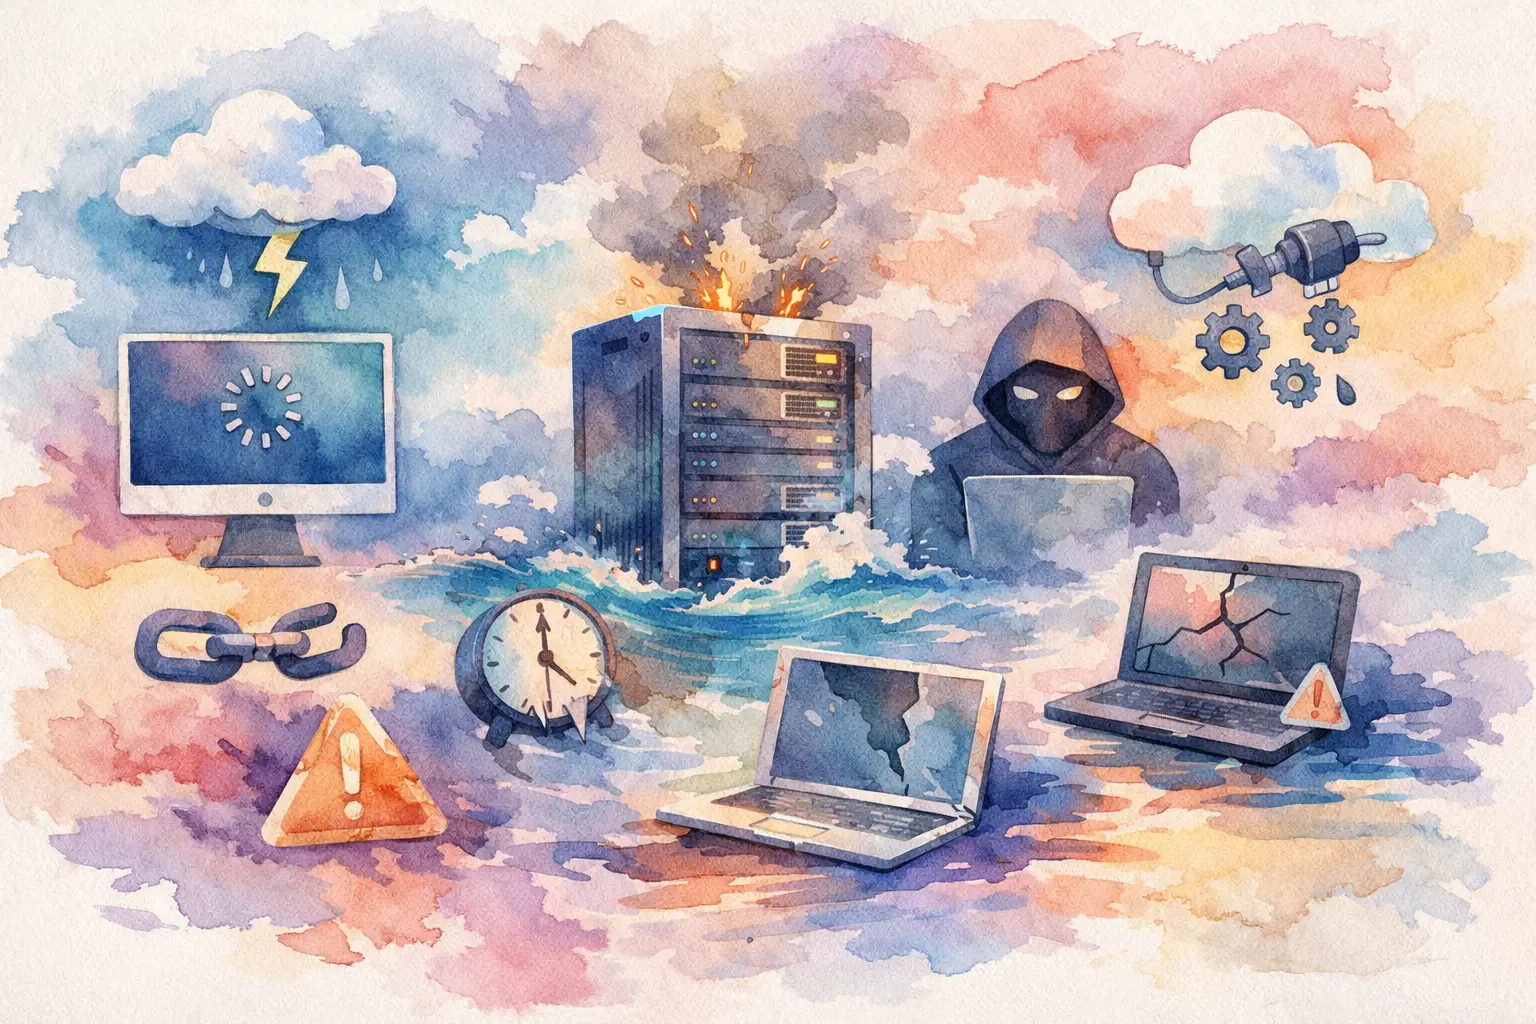
Incident that arrives at the client before arriving on the team is still common in SaaS. The problem is rarely lack of tool. In most cases, lack of observability end to end of truth - the one that connects user experience, services, queues, database, cloud and business impact in the same investigation.
When that doesn't exist, the diagnosis becomes an expensive guess. The team sees normal CPU, but the p95 exploded. The database looks stable, but a delayed queue is damping processing. The dashboard shows error 500, but the actual origin is on timeout between services or on a deploy that increased cardinality and overturned the query of metrics. Without context, every minute of the incident costs more than it should.
What is end-to-end observability
Point-to-point observability is not just collecting metrics, logs and strokes. That's the basics. The central point is to be able to follow a degradation from start to finish: from the action of the user or from an external event to the component that failed, with enough context to explain cause, effect and priority.
In practice, this means correlating technical signals and business signals. A slow checkout, onboarding or reporting generation cannot just appear as an increase in latency on an isolated chart. It needs to show which routes were affected, which tenants suffered the most, which external dependency responded badly, which version of the service was in production and how much this impacted conversion, retention or internal operation.
This point separates operational observability from decorative monitoring. The first one helps solve it. The second only confirms that there is one problem.
Because most teams think they do, but they don't.
A lot of operations already have APM, central logs, dashboards and alerts. Still, the response to the incident is still slow. The reason is simple: the pieces are loose.
It is common to see metrics in one system, logs in another, incomplete strokes and product events out of the technical flow. Partial instrumentation is also common. The front end does not propagate context. The asynchronous worker does not preserve correlation ID. The database doesn't enter the analysis with enough granularity. The alert triggers by generic symptom, such as CPU use, rather than reflecting actual error perceived by the user.
The result is known by any CTO or platform leader: long war room, too many people looking at the same screen, too many hypotheses and evidence of less.
Blocks that sustain end-to-end observability
The base remains metrics, logs and traces, but the value appears in the modeling quality. Metrics need to be useful for decision, not just abundant. Logs need to load request context, tenant, version, environment and component. Traces need to cross real system boundaries, including jobs, queues, external calls and background tasks.
In addition, domain events matter. In a SaaS, the team needs to observe actions such as account creation, note issue, payment processing, campaign submission, synchronization with ERP or reporting. Without it, you can see the machine, but you can't see the operation.
Another critical block is the bond with change. Deploy, feature flag, infrastructure change, credentials rotation and database migration need to enter the analysis timeline. Incident with no context of recent change usually becomes a ghost hunt.
Finally, there is the consumption layer. If no one trusts the dashboards, if the alert wakes up people for nothing, or if the consultation takes longer than the incident allows, the stack failed the goal.
Where implementation breaks down in real environments
The most common error is to start with the tool and not with operational questions. Time that does not know which flows need visibility ends up instrumenting everything in a generic way. It generates high cost, loud noise and little response capacity.
Another mistake is ignoring cardinality and retention. Mark everything with user\ id, request\ id, tenant\ id, region, plan, version, experiment and more twenty labels can destroy performance and cost of the observability platform. The design needs to balance depth and viability. Not all data needs to be indexed metrics.
It also breaks when architecture is already tensed. In systems with too many microservices, queues without clear contract, poorly configured relays and shared database between contexts, observability exposes the problem, but does not correct it alone. It accelerates diagnosis, but the root continues in coupling, poor modeling or weak operational discipline.
How to draw a strategy that works
The safest way is from critical business flows. Choose first what cannot fail without immediate impact: authentication, charging, onboarding, product central processing, essential integrations, public APIs and jobs that support customer SLA. Then map real dependencies of these flows.
Then define which questions the operation needs to answer in minutes. What route is degraded? Is the problem global or by tenant? It started after which deploy? Is it in the app, API, queue, database, external provider or resource containment? Which SLI was affected? These questions guide instrumentation better than any generic checklist.
The third stage is to standardize context. Correlation ID, trace ID, environment metadata, service version, tenant name, and flow classification need to follow through the entire system. Without it, there is no end to end. There's a collection of disconnected signals.
Then comes the phase that many companies jump: calibrating alerts based on relevant symptoms. Alerting by high CPU may make sense in some cases, but in general what matters is error rate, percentile latency, queue backlog, connection pool saturation, abnormal retry, useful throughput drop and degradation in critical journeys.
Technical metrics without business context are insufficient
Mature times learn that early. high p99 in an administrative endpoint with little use does not have the same weight as a bad p95 in login or checkout. Observability needs to prioritize what moves revenue, retention and customer confidence.
That doesn't mean turning engineering into BI. It means connecting telemetry to the actual operation of the product. If a financial integration accumulates delay, the impact may not appear in error 500, but appears in queue dammed, increased support, billing delay and client blocked by incomplete process.
When this connection exists, prioritization improves. The team stops treating everything as an emergency and starts responding to what really threatens SLA, margin or user experience.
Tool matters, but observability architecture matters more
There's a recurring discussion about ideal stack. OpenTelemetry, commercial platforms, own storage, centralized dashboards, distributed tracing, eBPF, RUM, continuous profiling. This could all make sense. But the right choice depends on the product stage, internal competence and operational budget.
In a smaller operation, consolidating signals on fewer surfaces usually brings more results than mounting a sophisticated pile too soon. In a company with multiple services, high volume, harder compliance and distributed teams, the strategy needs to scale governance, retention, cost and ownership.
The point is not to have the most modern stack. It is to have a stack that the team can operate, understand and evolve without becoming hostage of obscure configuration or unpredictable account at the end of the month.
Real gain: less MTTR, less noise, better decisions
When end-to-end observability is well implemented, the effect appears fast. The MTTR falls because the investigation begins closer to the cause. The number of false positives decreases because the alert reflects actual system behavior. The team makes less meeting to discover the basics and more useful intervention.
It also improves the conversation between engineering and business. Instead of discussing perceptions, the team shows evidence: which flow degraded, for how long, for how many clients, with what probable cause and which correction reduces risk of recurrence.
This is the point where observability is no longer spent on a platform and becomes an operational control mechanism.
What to charge for a mature operation
A mature operation can respond speedily to three levels of question. First, what's broken now. Second, because it's broken. Third, what has changed to make this likely. If the team still depends on tribal knowledge or a specific person to connect the points, maturity is below what is needed to climb safely.
It's also worth taking discipline. Instrumentation needs to enter the normal engineering cycle, not be treated as an optional task. Deploy without enough telemetry is blind change. New service without clear SLI is operational debt arising ready.
In practice, this is what separates teams that operate with confidence from teams that only react better to chaos. The difference is not to have more graphic. It is in having actionable evidence, from user to database, from deploy to business impact.
If your SaaS already feels the cost of long incidents, invisible necks and decisions made in the dark, end-to-end observability is not refinement. It's a technical management infrastructure. And the sooner it reflects the real system, the less expensive it grows.